
Current Projects
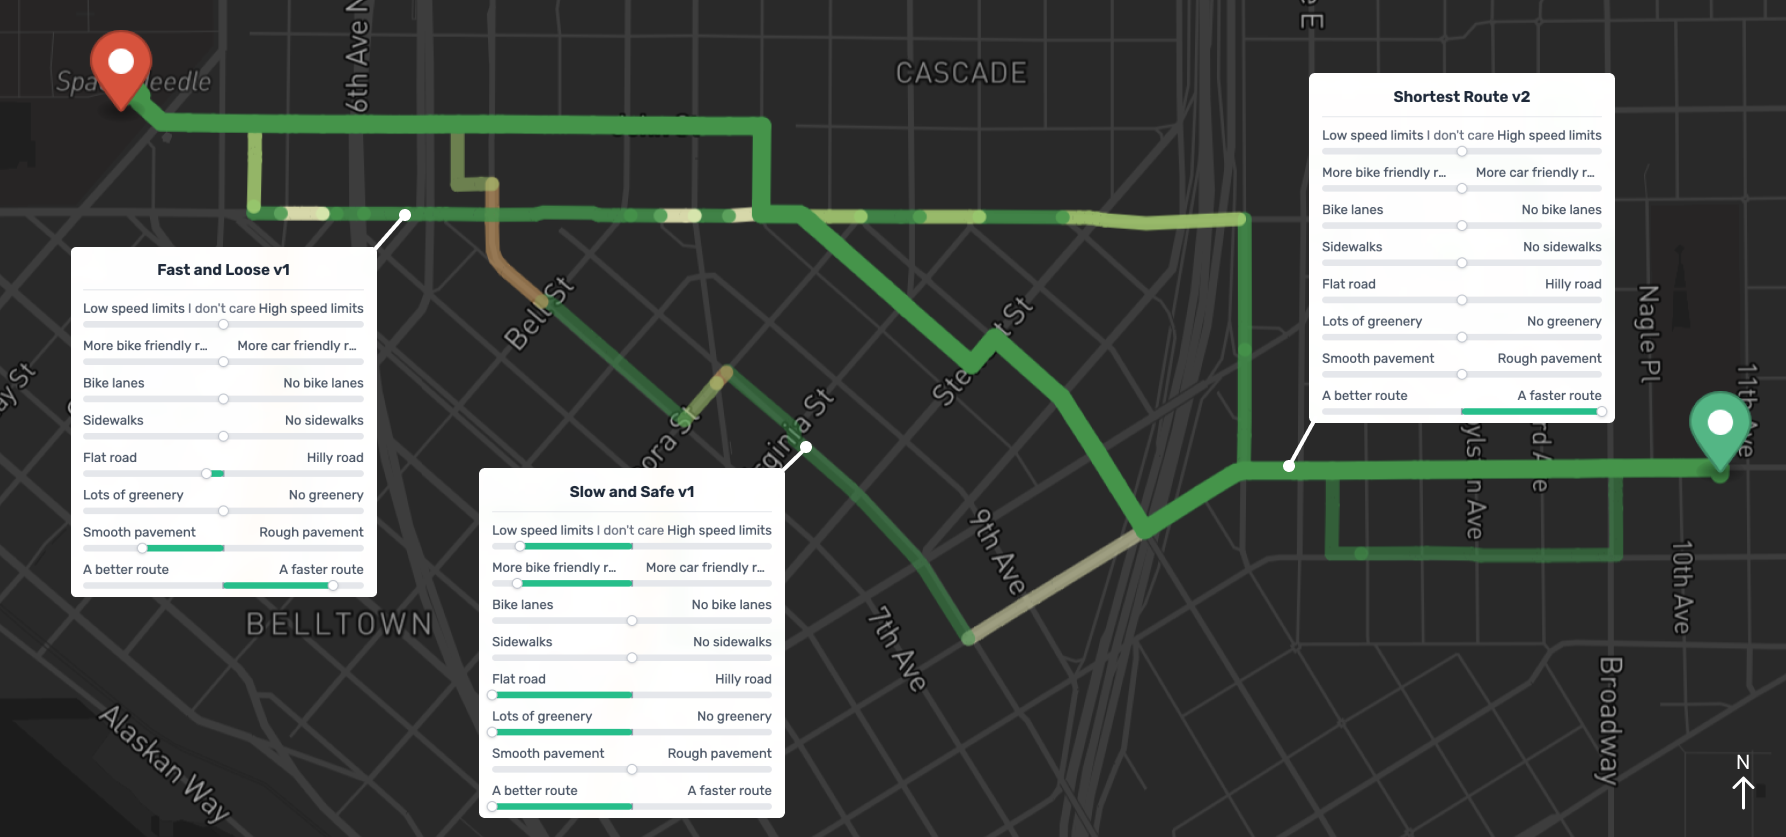
Urban cycling benefits personal wellbeing, public health, and global sustainability. While current tools such as Google and Apple Maps provide bike route recommendations, they do not account for a person’s dynamic context (e.g., commuting, recreation). We introduce BikeButler, a personalized, context-sensitive bicycle route generation tool that enables users to generate, compare, virtually preview, and iteratively customize bike routes via custom profiles that encode seven bikeability features, including bike lane existence, slope, vegetation, and surface quality—fusing data from OpenStreetMap, open government data, and a custom VLM-based analysis of Street View images. To design BikeButler, we employed a human-centered, iterative approach starting with formative interviews and culminating in a user study (N=16). Our findings demonstrate that bike routing preferences change as a function of context, that BikeButler enables users to quickly create and iterate context-sensitive routes, and that generated routes differ significantly from Google Maps bike routing, reinforcing the importance of personalization.
Related Publications
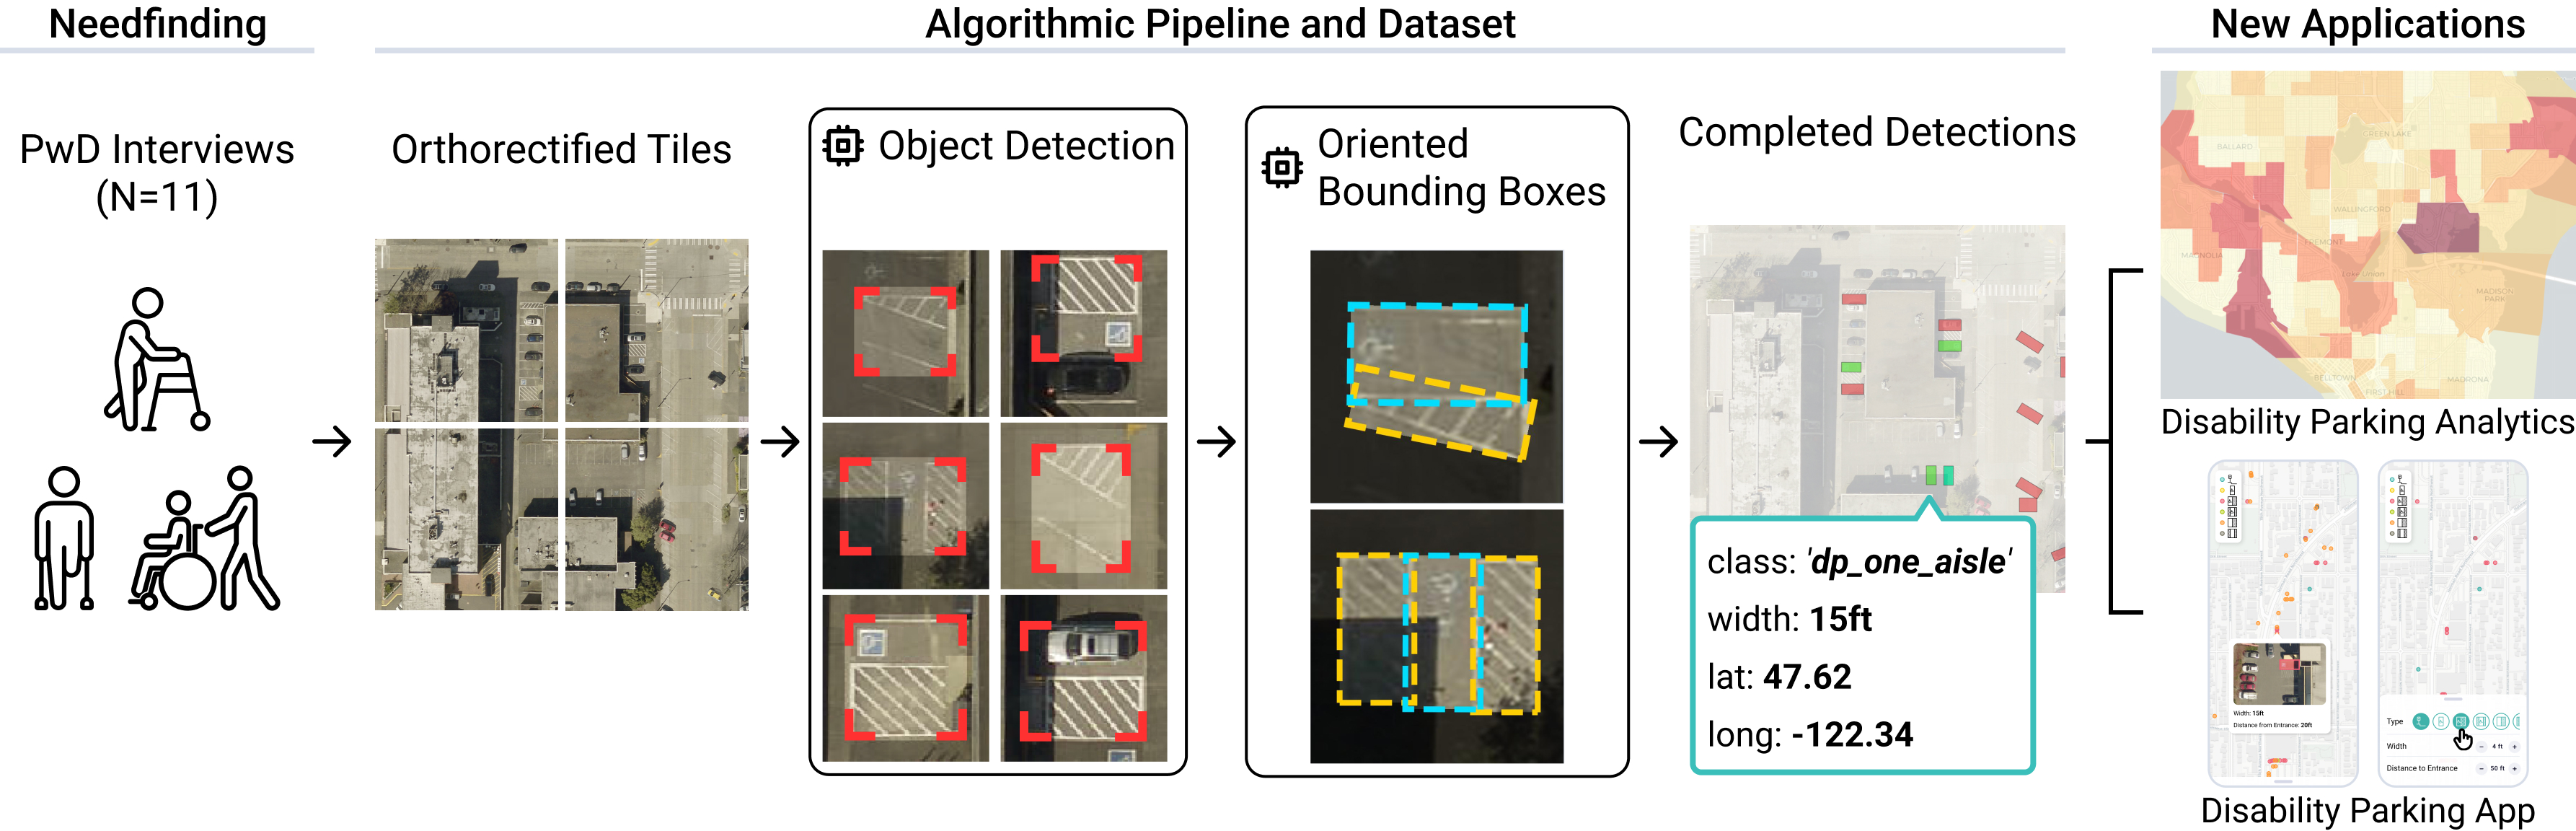
Accessible parking is critical for people with disabilities (PwDs), allowing equitable access to destinations, independent mobility, and community participation. Despite mandates, there has been no large-scale investigation of the quality or allocation of disability parking in the US nor significant research on PwD perspectives and uses of disability parking. In this work, we first present a semi-structured interview study with 11 PwDs to advance understanding of disability parking uses, concerns, and relevant technology tools. We find that PwDs often adapt to disability parking challenges according to their personal mobility needs and value reliable, real-time accessibility information. Informed by these findings, we then introduce a new deep learning pipeline, called AccessParkCV, and parking dataset for automatically detecting disability parking and inferring quality characteristics (e.g., width) from orthorectified aerial imagery. We achieve a micro-F1=0.89 and demonstrate how our pipeline can support new urban analytics and end-user tools. Together, we contribute new qualitative understandings of disability parking, a novel detection pipeline and open dataset, and design guidelines for future tools.
Related Publications
Past Projects
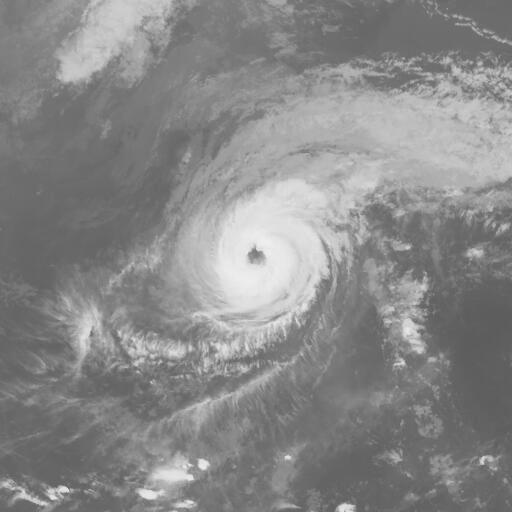
The Digital Typhoon Project aims to collect, standardize, and curate typhoon (hurricane) satellite images in the Western North Pacific. It was started in 1997, and the Digital Typhoon Dataset covers over 40 years from 1978 to 2023 – the longest typhoon satellite dataset available.
With the dataset, the project hopes to reduce the burden of researchers to begin peforming ML on tropical cyclones without needing in depth meteorology and satellite remote sensing knowledge.
 |
|---|
| An overview of the dataset and projection of globe images to 2D. |
Releasing the Dataset: the Last Mile
Before I joined the project, the dataset existed only as part of a browsable UI on the Digital Typhoon website. It wasn’t an ML-ready dataset:
- There was no organized file structure. No defined delineation of seasons (years), typhoon sequences, etc.
- No way to interact with the dataset in a controlled manner
- Loading into a program isnt as simple as reading in all the images and labels
- Without thoughtfully splitting the dataset into test/train/validation sets, leakage could occur between sequences and years
- How to link ground truth data to images? The ground truth is taken from best track data, which doesn’t line up 1:1 to the satellite images
- Doing engineered splits, such as splitting between satellite generations
- We had no benchmarks as to how well the dataset worked with current ML models
The result was a highly valuable dataset only accessible via the web UI, which many people scraped to access, resulting in ML models trained off of lossly compressed JPEG images with potential graphical artifacting, and non-standardized.
pyphoon2
 |
|---|
| An overview of the structure of the dataset |
To cover the last mile and make the Digital Typhoon Dataset an easily downloadable dataset with a fast download-to-ML turnaround time, I developed pyphoon2, a PyTorch dataloader which offers:
- Automatic reading and loading of the data into sequence objects, with ground truth labels accessible via object attributes
- Hands-off random splitting by image, sequence, or season
- Filtering, transforms, and selection by any label attribute
- Interpolation and dataset modification
- All the flexibility of PyTorch, making using the dataset “plug and play”
You can find pyphoon2 here.
Benchmarking
I also led the benchmarking efforts between myself and the two other students on the project. We defined three tasks applicable to the dataset and developed models to address all three:
- Analysis
- Forecasting
- Reanalysis
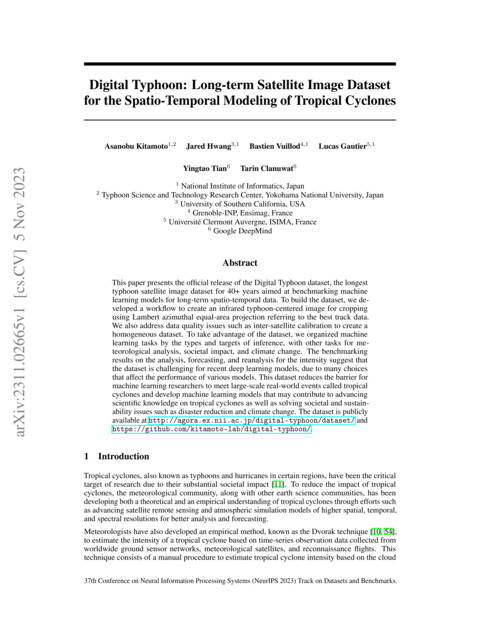
You can see the definitions and our results in our paper, where we published the benchmarks and dataset to the NeuRIPS 2023 Datasets and Benchmarks track:
Digital Typhoon: Long-term Satellite Image Dataset for the Spatio-Temporal Modeling of Tropical Cyclones [pdf]
Or browse the Digital Typhoon website.
Related Publications
Liquid argon time projection chambers (LArTPCs) are a type of particle detector used in neutrino experiments. To make the most of the detector data, we must reconstruct and identify particle paths through the detector accurately. The Neutrino Group at Tufts University explores the use of deep neural networks to reconstruct particle interactions.
Project 1: Attempting centroid based instance segmentation on LArTPC images
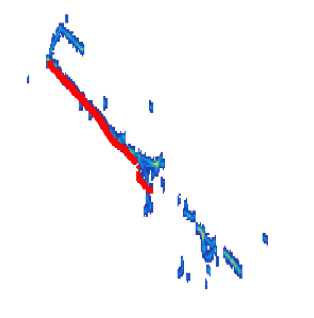
To separate the different elements of a neutrino interaction (trunk, shower, etc.), we attempt to use a novel centroid based loss-function to perform instance segmentation. See the loss function paper here.
, and a shower (that thick line splitting off into several smaller lines)") |
|---|
| The ground truth of instance segmentation in our project. Note the shower is missing from the highlight, a problem with the labeling upstream. |
Unfortunately, application of the technique gave poor results for LArTPC data, possibly due to the vastly different shape of objects in the dataset.
Project 2: Compressing LArTPC images using Autoencoders
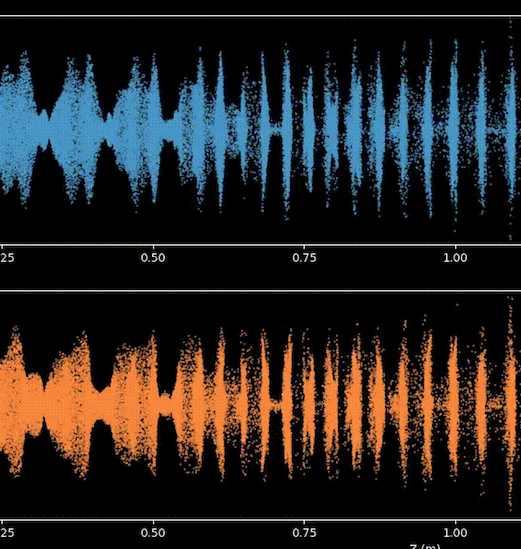
LArTPC detectors produce terabytes of data per second. Finding a way to make these images smaller would vastly decrease cost and increase flexibility and convenience of analysis. Using a VQVAE (Vector Quantized Variational Autoencoder), we can learn a latent space for the LArTPC images and interactions, train an encoder and decoder, and save just the encoded images. At analysis, we then can apply the decoder.
By tiling LArTPC images into VQVAE-acceptable image sizes, and reconstructing decoded tiles, we achieved up to 80% reduction in file size compared to traditional JPEG compression.
.") |
|---|
| An example of tiles compressed and reconstructed using the VQVAE. Top is the original images, bottom is the reconstructed. |
The IsoDAR experiment searches for sterile neutrino oscillations and non-standard neutrino interactions. Once built, the IsoDAR accelerator will send dihydrogen molecules through a radio frequency quadrupole (RFQ), then a cyclotron, to then impinge onto a Be and Li target, producing antineutrinos that we detect and can study.
To predict the behavior of the H2+ through the RFQ, we simulate it.
 |
|---|
| Video of an RFQ simulation |
The Problem
All RFQ simulation software at the time had at least one problem:
- By not simulating space-charge (interaction between charged particles) it was inaccurate.
- It was proprietary.
- It didn’t play well with other software (such as the input and output of other particle accelerator elements), and was difficult to use and tune.
- It was slow
The Solution
I developed PyRFQHelper, an RFQ simulation software from the ground up designed to solve those problems and more. To address the issues:
- It’s built on top of WARP, a particle-in-cell simulation framework that takes space-charge into account.
- It’s built open-source.
- It’s built to accept a wide variety of input data forms and output a simple format.
- Despite already being faster, we integrated parallel-processing capability.
In addition, it:
- Visualizes simulation results
- Automatically calculates statistics of interest (emittance, electric field, etc.)
- Uses clustering to determine particle bunch size and statistics at simulation end
Simulations were also easily customizable (being built on top of WARP), so new components in different shapes could easily be added or removed from the simulation.
Results
A simulation software that performs as fast, and with parallelization, faster than competing software, that’s flexible and scientifically accurate.
More about IsoDAR can be read at the website or in the paper.
Project code can be found here.